Week 3 Atomic Structure
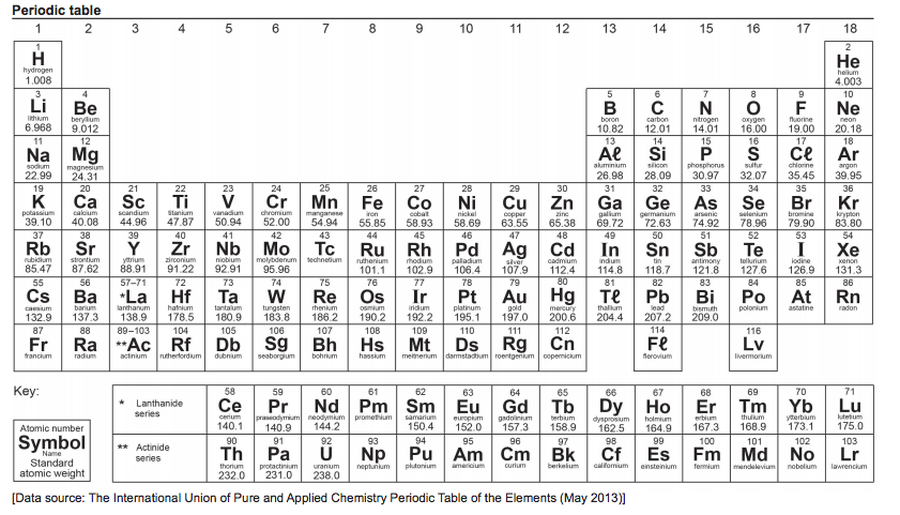
Task 1 Periodicity of the elements
Input Side (RHS)
- Make a table with the column headings Atomic Number, Element, Boiling point (oC).
- Visit this site and record data for the boiling points of the first twenty elements of the periodic table. http://www.chemicalelements.com/show/boilingpoint.html
- On graph paper plot the boiling point data against atomic number of the elements. Choose a suitable scale as some of the temperatures are below zero. Remember to include a title, and labels on the axes.
BRING YOUR GRAPH TO CLASS
Questions
- On your graph, show in another colour where Periodic Table Periods 1, 2 and 3 begin.
- On each point on your graph write the symbol of the element.
- Describe the shape of your graph.
- Describe what happens to the trend of boiling points across a period of the Periodic Table.
- Describe what happens to the trend of boiling points across the first twenty elements of the Periodic Table.

Melting points of the first twenty elements of the Periodic Table. Click to see more elements.
LHS
Describe the shapes of the graphs showing;
Describe the similarities that you see with your plot of the boiling points of the first twenty elements.
Explain why the Periodic Table of Elements is so called.
Describe the shapes of the graphs showing;
- density plotted against atomic number and
- Ionisation energy (metallic nature) plotted against atomic number
Describe the similarities that you see with your plot of the boiling points of the first twenty elements.
Explain why the Periodic Table of Elements is so called.

Density of the first twenty elements of the Periodic Table.
|
Metallic nature of the first twenty elements of the Periodic Table.
|
Task 2 Atomic Structure
On your Right-side (Input) page write the heading and the date.
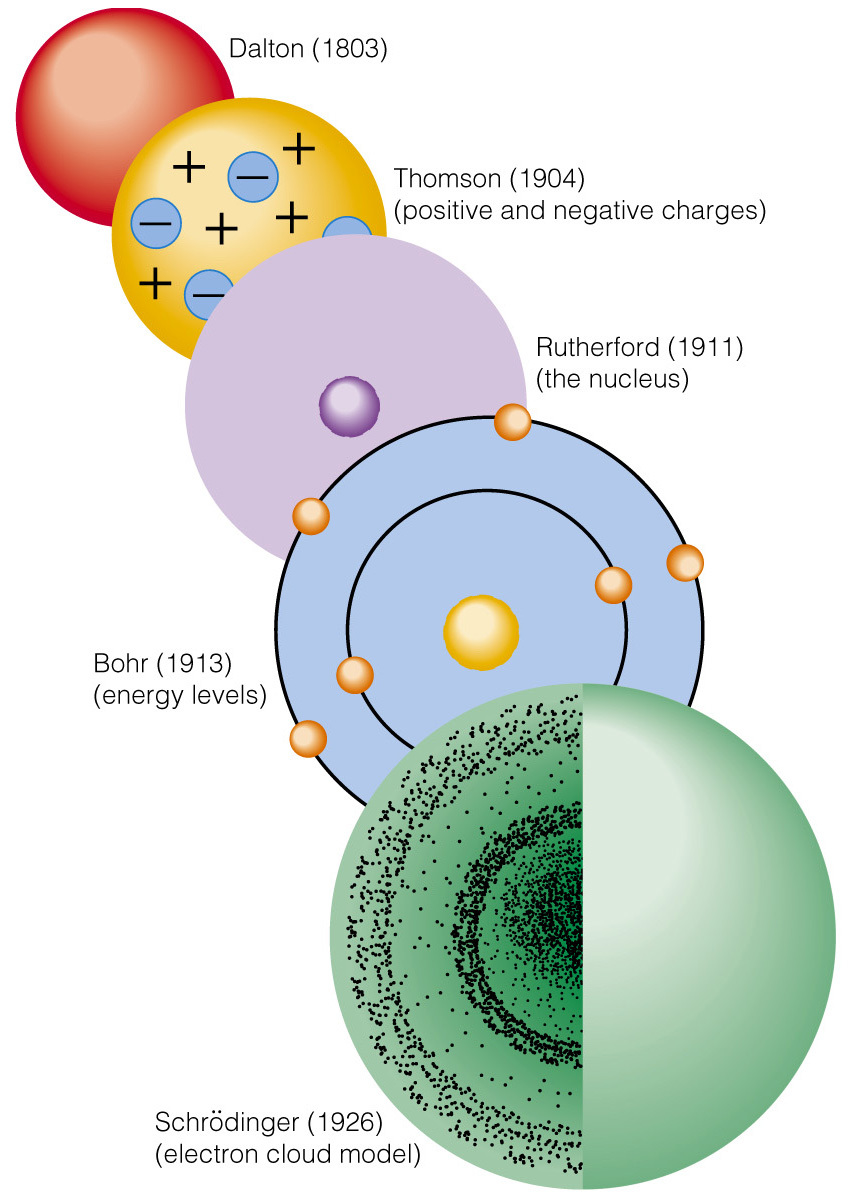
Take notes on the development of the model of the atom.
Subheadings should include;
Take notes on the development of the model of the atom.
Subheadings should include;
- Date and Scientist
- Observations and measurements from experiments
- Inferences about atomic structure
- Significance to the atomic model
Structure of the atom - more detail than Professor Cox
| atom_time_line.docx |
On your Left-side (Output) page write the heading and the date.
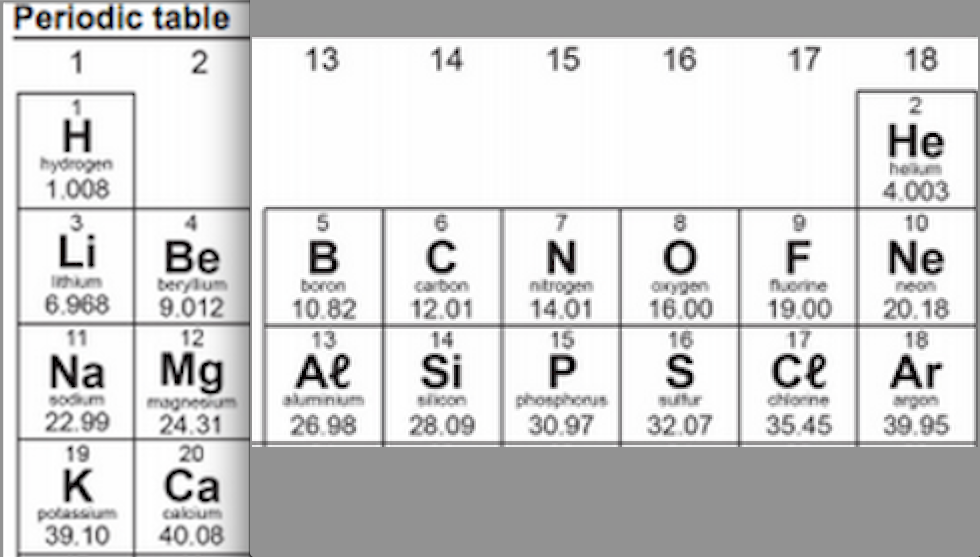
Use information on your periodic table to draw a model of a magnesium atom as
Use information on your periodic table to draw a model of a magnesium atom as
- Dalton would have inferred it.
- Thompson would have inferred
- Rutherford would have inferred
- Bohr would have inferred
- the Quantum model infers
http://wps.prenhall.com/wps/media/objects/439/449969/Media_Portfolio/Chapter_05/FG05_26.JPG
Atomic Number and Mass Number
Chemical Reactions
Chemical reactions played an important role in developing our understanding of the model of the atom.
We will use a simple chemical reaction to demonstrate John Dalton's thinking.
(We will explore the concepts further during the course.)
Take a small piece of magnesium ribbon, clean it with steel wool and react it with oxygen gas from the atmosphere.
On the Left-side page.
Record your observations of the two reactants before the reaction and the product after the reaction.

Reactants: Magnesium ribbon: a lustrous, "silvery" malleable solid
and Oxygen: odourless, colourless gas
|
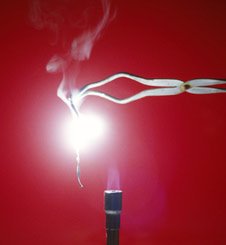
magnesium and oxygen reacting giving out white light and heat energy
|
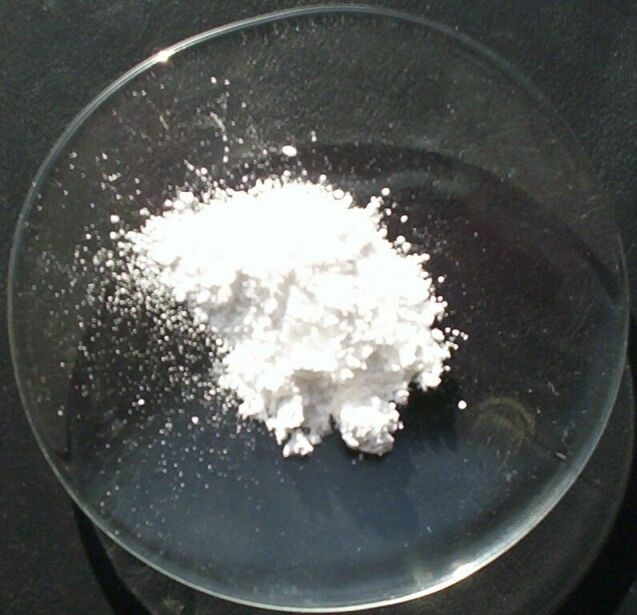
Product: magnesium oxide, a white , brittle solid
|
We know the formula for oxygen gas and the symbol for magnesium.
Beneath your written observation;
Beneath your written observation;
- On the left of the page write the formula for oxygen gas and symbol for magnesium and
- draw a Dalton model beneath each material.
- Draw an arrow to represent the process of the reaction.
- To the right of the arrow write the formula for the product formed.
- Draw the atom arrangement as Dalton would have visualised it.
Task 3 - Electron arrangement in atoms of the first twenty elements of the periodic table
Bohr Model of atoms
Fold your periodic table so that it looks like this;
The grid goes on the Right-side page (input)
On your grid write the symbol for the atom and its atomic number in the top of each cell.
The rules
Up to;
On your grid write the symbol for the atom and its atomic number in the top of each cell.
The rules
Up to;
- two electrons can be held in the first energy level
- eight electrons can be held in energy levels two and three.
Electron arrangement of the first twenty elements of the periodic table
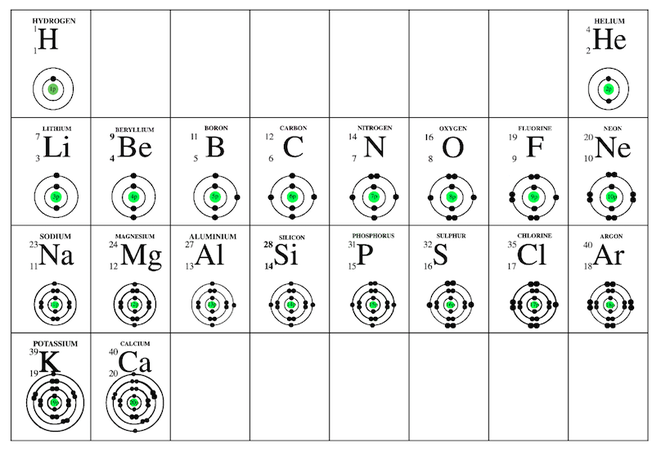
The circles that you have drawn represent energy levels of the electrons.
- Describe the similarities of atoms across period 1, across Period 2, across Period 3, across Period 4.
- Describe the similarities of atoms down Group 1, down Group 2, down Group 13, down Group 14, down Group 15, down Group 16, down Group 17, down Group 18.
- Describe what happens to the diameter of atoms down a group. Explain why this occurs.
- Describe what happens to the diameter of atoms across a period. Explain why this occurs.
Electron Configuration
Drawings showing electron arrangement are useful for us to visualise the atoms and understand some trends. They are cumbersome to draw.
A shorthand for these drawings is to use a notation called electron configuration.
The electron configuration of a calcium atom is written like this; 2, 8, 8, 2
Compare this notation to the drawings of the atoms on the periodic table
A shorthand for these drawings is to use a notation called electron configuration.
The electron configuration of a calcium atom is written like this; 2, 8, 8, 2
Compare this notation to the drawings of the atoms on the periodic table
- What do the numbers represent?
- What do the commas represent?
- What does the space, that the number is in, represent?
- How does information tell us where each element is found on the periodic table?
- Complete writing the electron configurations for the first twenty elements.
