Week 11 REVIEW
Investigation Validation Test Feedback
1. Averages
State the average to the same number of decimal places as the values in the trials. Remember that the decimal places tell us how ACCURATELY the measurements were taken.
3. Variables
Take care that you name the variables, not the quantity that they are measured in.
Avoid using the word "amount". Write what you really mean; volume? mass?
6. Graphing
Step 1 - Think about the type of graph that you will plot and explain why this is the correct type of graph to plot.
Step 2 - Draw up axes to fit the page.
Step 3 - Label the axes with the variable and the (units) in which the variable was measured. Remember; X axis-Independent, Y axis - dependent.
Step 4 - Make even intervals along the axes to represent the values of the variables.
Step 5 - Plot the relationship, using the AVERAGE values that you calculated.
Step 6 - Write a title that states the relationship between the two variables
Why do you plot average results? Does it have anything to do with RELIABILITY? In what way?
Describe the overall shape of the graph. Is this a straight line, or a curve? What does a curved line tell us about reaction rate?
Decide if the relationship shown is directly or inversely proportional.
Analysis
7. Graphs are used as tools for prediction.
Interpolation is predicting within/between the data collected.
In the second Investigation the students found that with 2M HCl the reaction rate was 35 bubbles/minute. Use this data to find the particle size and the reaction rate in the first Investigation with 2M HCl.
10. Reliable
Think "same".
Accurate
Think "sharp"
State the average to the same number of decimal places as the values in the trials. Remember that the decimal places tell us how ACCURATELY the measurements were taken.
3. Variables
Take care that you name the variables, not the quantity that they are measured in.
Avoid using the word "amount". Write what you really mean; volume? mass?
6. Graphing
Step 1 - Think about the type of graph that you will plot and explain why this is the correct type of graph to plot.
Step 2 - Draw up axes to fit the page.
Step 3 - Label the axes with the variable and the (units) in which the variable was measured. Remember; X axis-Independent, Y axis - dependent.
Step 4 - Make even intervals along the axes to represent the values of the variables.
Step 5 - Plot the relationship, using the AVERAGE values that you calculated.
Step 6 - Write a title that states the relationship between the two variables
Why do you plot average results? Does it have anything to do with RELIABILITY? In what way?
Describe the overall shape of the graph. Is this a straight line, or a curve? What does a curved line tell us about reaction rate?
Decide if the relationship shown is directly or inversely proportional.
Analysis
7. Graphs are used as tools for prediction.
Interpolation is predicting within/between the data collected.
In the second Investigation the students found that with 2M HCl the reaction rate was 35 bubbles/minute. Use this data to find the particle size and the reaction rate in the first Investigation with 2M HCl.
10. Reliable
Think "same".
- What variables were kept the same (controlled) during the experiment?
- Why are trials repeated and the results averaged?
Accurate
Think "sharp"
- How were quantities measured?
- Was the measuring equipment appropriate for the job?
END OF TOPIC TEST - Wednesday 17 April
This test will cover from week 5 of your chemistry program
Task 1 Complete Homework Book Exercises by Tuesday 16 April
Activities 5.13, 5.15, 5.16, 5.17, 5.18
This will form the basis of your study for the End-of-Topic Test on Wednesday 17 April
This will form the basis of your study for the End-of-Topic Test on Wednesday 17 April
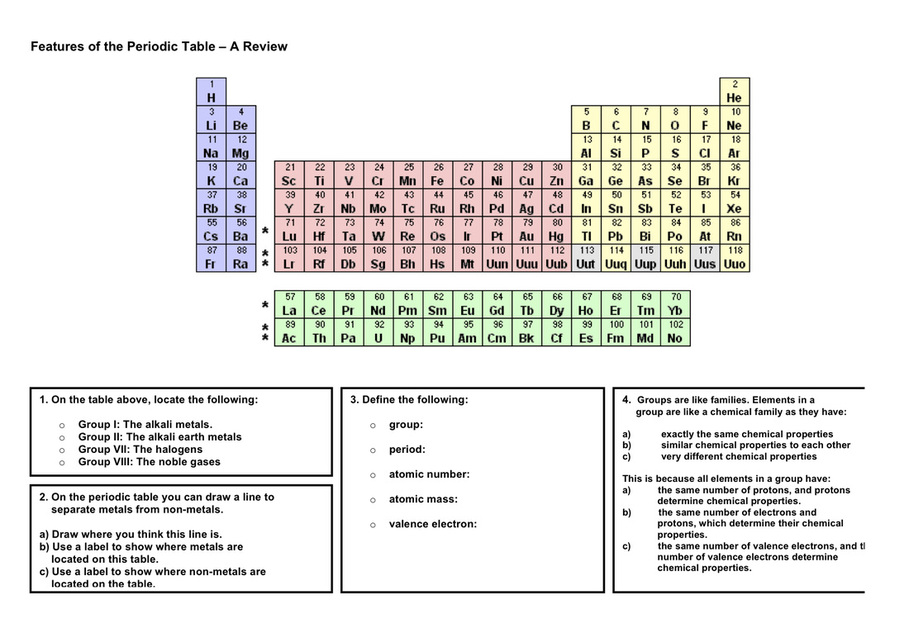
Task 2 Review Periodic Table
You can download this image or use a periodic table that you already have to complete the tasks
Task 3 Writing Ionic Formulae
Review your Periodic Table showing electron configuration, or electron dot diagrams, and you see an easy way to remember the type of charge and the size of the charge on each ion.
Use the Valency Table to write correctly balanced formulae for the given compounds.
Use the Valency Table to write correctly balanced formulae for the given compounds.
- Watch Video: Junior Chemistry: Compounds 1 and Junior Chemistry: Compounds 2
- Complete Science Aspects 2 Focus 5.? to practice formula-writing
Task 4 Covalent (or molecular formulae)
Non-metal atoms have 4 or more electrons in their outer electron shells. These are called VALENCE ELECTRONS.
Non-metal atoms tend to rip electrons off metal atoms. When non-metal atoms bond with other non-metal atoms they cannot sometimes be the ripper and sometimes be the rippee!!
Non-metal atoms tend to rip electrons off metal atoms. When non-metal atoms bond with other non-metal atoms they cannot sometimes be the ripper and sometimes be the rippee!!
- How do non-metal atoms bond together?
- Watch the video Junior Chemistry: Compounds 3
- Complete SA2 Page 242
Meet the element carbon
An introduction to organic chemistry. Follow the links below and complete the tasks to the right-hand-side of the video clips.
Meet a catalyst
"Elephant Toothpaste"
http://splash.abc.net.au/media/-/m/107268/
- http://splash.abc.net.au/media/-/m/105464/undefined?source=search
- http://splash.abc.net.au/media/-/m/106872/undefined?source=secondary-science
Meet a catalyst
"Elephant Toothpaste"
http://splash.abc.net.au/media/-/m/107268/
