Science Inquiry
Definition of the Scientific Method
by the Nobel Prize-winning physicist Richard Feynam in one of his lectures in 1964 at Cornell University, NY.
|
"Discovering new laws of Nature" by R. P. Feynman
Transcript: "In general we look for a new law by the following process. First we guess it. Then we compare the consequences of the guess to see what would be implied if this law that we guessed is right. Then we compare the result of the computation to Nature, with experiment or experience, compare it directly with observation, to see if it works. If it disagrees with experiment it is wrong. In that simple statement is the key to science. It does not make any difference how beautiful your guess is. It does not make any difference how smart you are, who made the guess, or what his name is — if it disagrees with experiment it is wrong." |
|
Physical Quantities
You can easily measure fundamental physical quantities, and their units, in your science laboratory.
mass - (kilograms or kg)
length - (metres or m)
time - (seconds or s)
temperature - (degrees Celcius) [the unit for temperature that chemist and physicists use is the Kelvin; but that is another story]
electrical charge - (amperes or A)
You can calculate other quantities from these fundamental quantities. For example;
velocity - (ms-1)
acceleration - (ms-2)
Force - (newtons or N)
Work - (joules or J)
Electrical resistance - (ohm or Ω)
Variables
Variables are the QUANTITIES that can be measured, not the UNITS.
For example heart rate is a quantity; beats per minute is the unit.
When constructing an hypothesis use the quantity, not the units.
For example: The longer the time spent exercising, the greater the heart rate.
For example heart rate is a quantity; beats per minute is the unit.
When constructing an hypothesis use the quantity, not the units.
For example: The longer the time spent exercising, the greater the heart rate.
- Independent variable - the variable that the experimenter, or “I” change.
- Dependent variable - the variable that responds to the independent variable.
Do not use the term “AMOUNT”. State the quantity that would be measured.
For example MASS of dog food, or VOLUME of dog food.
Accuracy
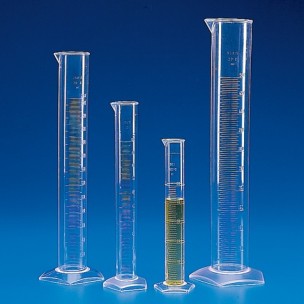
http://www.m2scientifics.com/2909-large_default/100ml-pmp-molded-graduations-graduated-cylinder.jpg
|
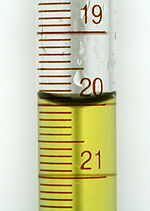
To read volume accurately read the scale mark at the bottom of the meniscus.
http://upload.wikimedia.org/wikipedia/commons/thumb/4/4e/Meniscus.jpg/150px-Meniscus.jpg
|
To avoid parallax error and read the volume accurately line up the bottom of the meniscus, the scale line and your eye in a horizontal line. See diagram below to see how the measurement changes which different lines of sight.
http://homepages.ius.edu/dspurloc/c121/images/anglemeniscus.gif
|
The Hypothesis
A short statement of the relationship between the independent and the dependant variable.
Do not start the hypothesis with the term “I believe...” or “I think...”. An investigation is an objective study of evidence.
You may use this structure for the hypothesis;
You may use this structure for the hypothesis;
- “As the _____ (independent variable) increases the _____ (dependent variable) increases” or
- the null hypothesis “If the _______ (independent variable) increases then there will be no change to the _________ (dependent variable)."
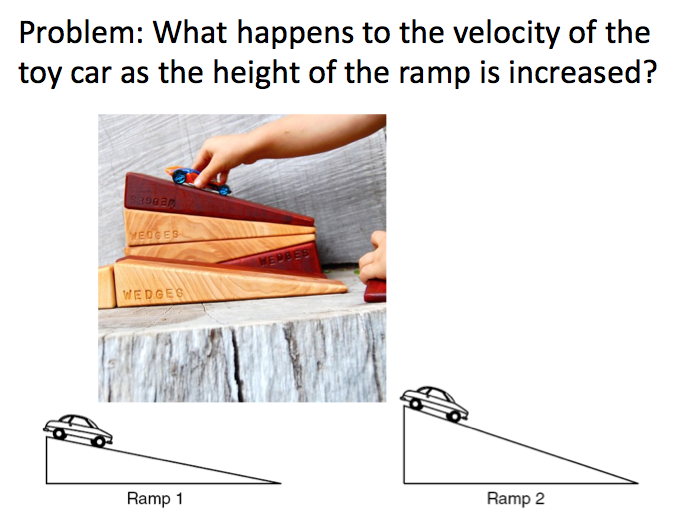
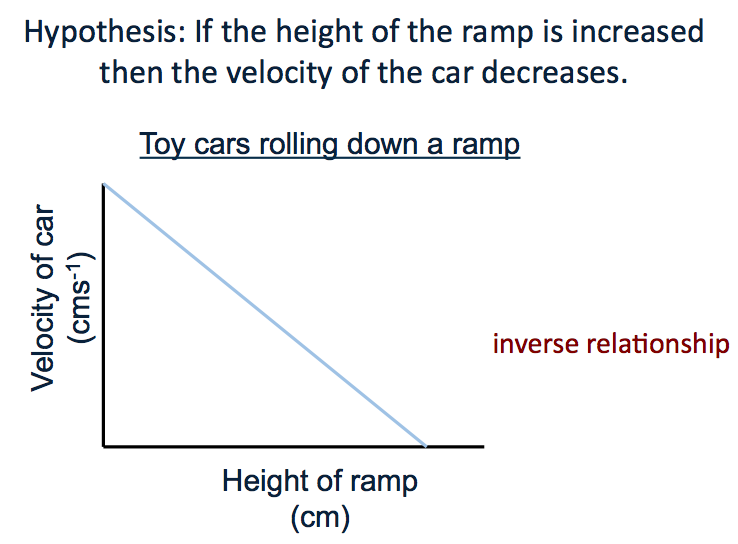
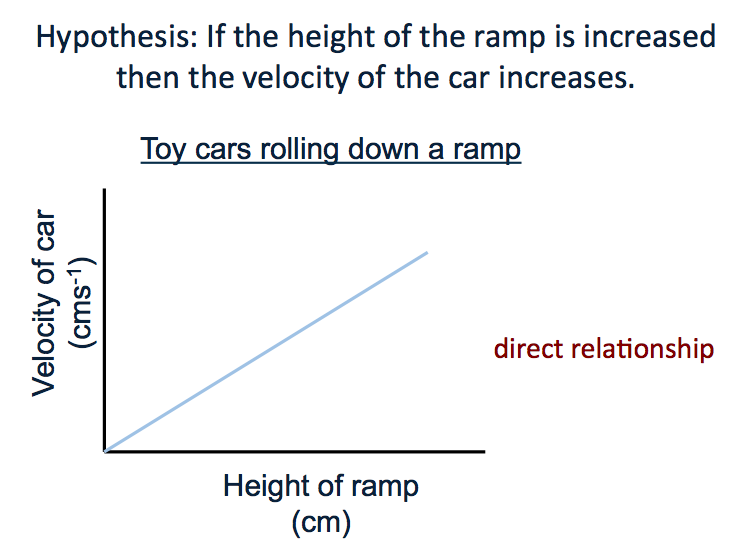
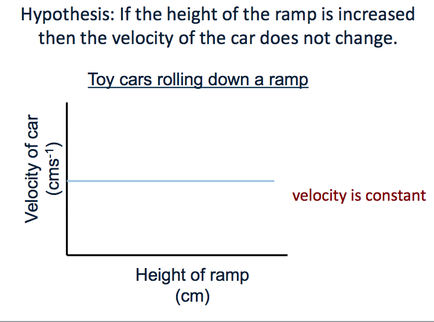
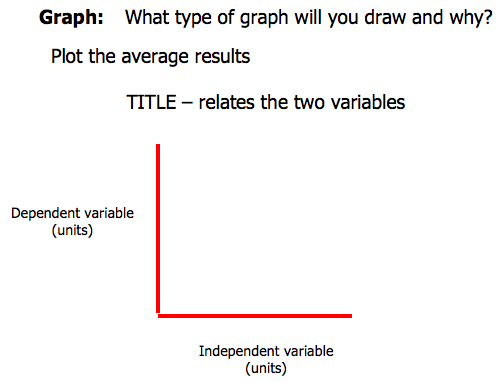
Visualising the hypothesis
If we can visualise the relationship between the independent and the dependant variables then it helps us form the hypothesis and predict our expectations.
Once the data is gathered and plotted then we can easily compare the hypothesis with the results.
|
|
Reliability
If you need to test the range of frequencies that a breed of dog can hear do you test many or a few? Which is a more reliable sample and why?
Do you conduct the test many times or a few times? Which is more reliable and why?
Do you conduct the test in the same conditions each time? Why?
Do you conduct the test many times or a few times? Which is more reliable and why?
Do you conduct the test in the same conditions each time? Why?
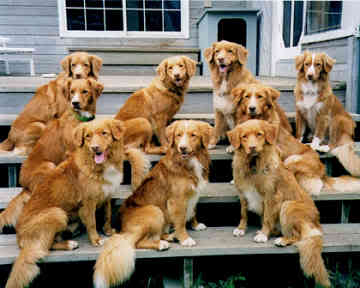
http://i577.photobucket.com/albums/ss218/DogGoneGood/BreedsPictures/NovaScotiaDuckTolling2.jpg
|

Charlie - a Nova Scotia Duck Tolling Retriever
|
At least three trials are conducted in an investigation so that the effect of individual differences is decreased. This leads to RELIABILITY not ACCURACY.
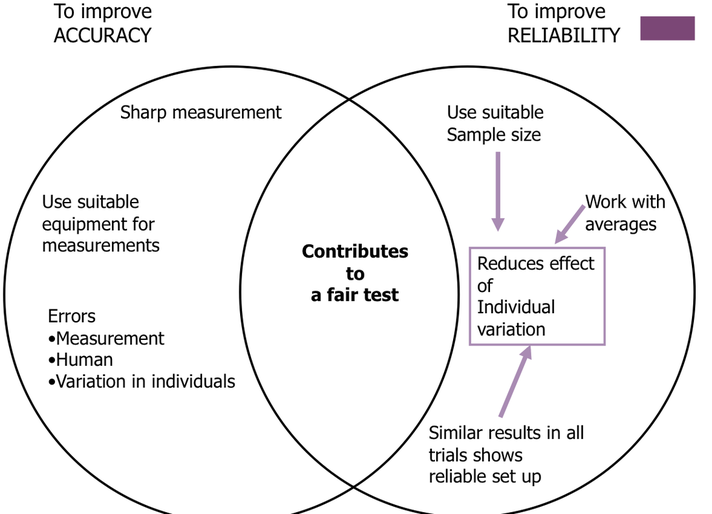
The Relationship between the Concepts of Accuracy and Reliability
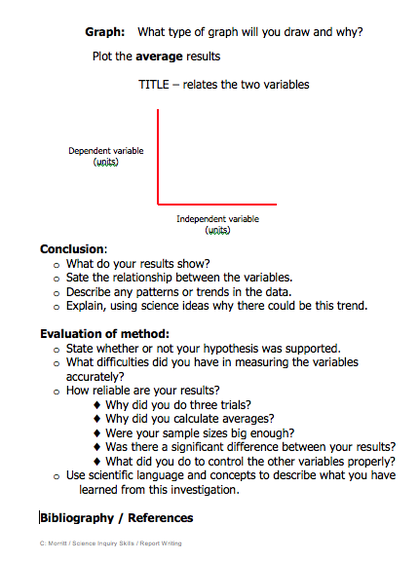
Relationships between the variables
Here you are looking for either a;
- directly proportional relationship (as the independent variable increases, the dependent variable increases).
- inversely proportional relationship (as the independent variable increases, the dependent variable decreases).
- no relationship between the variables.
Evaluating the Investigation
When you are asked for improvements to an investigation you are being asked to think about how you could improve the ACCURACY, RELIABILITY and reduce errors. See Venn Diagram above for methods to do this.
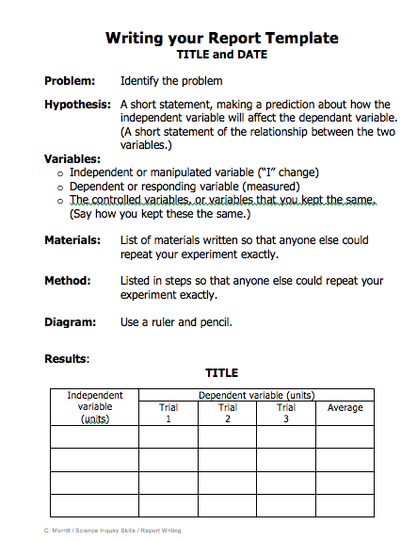
Conventions for Writing Science ReportsWhen your investigations are complete, a science report is written to communicate your work.
A good science report consists of sections and follows the format listed below:
The hypothesis is a short statement relating the independent variable and the dependent variables. The hypothesis is tested with an investigation. When writing the Discussion of Results show off all of the scientific language that you have learned in the topic. Explain your findings by relating them to the concepts you have studied. Accuracy relates to the sharpness of measurement Use appropriate measuring equipment with the correct scale. Reliability relates to getting similar results each time you gather data. |
| ||
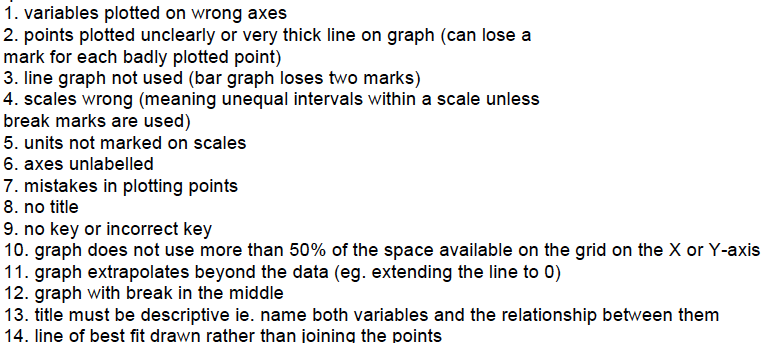
Graphing marking key
|
|
Averages
When you write numbers to the right of a decimal point you are indicating the order of accuracy of the measurement.
If the table gives data to one decimal place then it is telling you that the measurement was taken at that level of accuracy.
If you write average values to two or more decimal places then you are saying that the measurements have been more accurate than the original data. This cannot be so!
The rule is keep your averages to the same level of accuracy as the data given in the table.
| data_analysis.pdf |
| components_of_a_scientific_conclusion.pdf |
Sites that help students build research skills
Reliability and Validity
Accuracy and Precision
Short videos exploring aspects of the Scientific Method
Mr Bozeman gives a history of the Scientific Method.
Doctor and epidemiologist Ben Goldacre shows us, at high speed, the ways evidence can be distorted, from the blindingly obvious nutrition claims to the very subtle tricks of the pharmaceutical industry.
Discusses the Control and the placebo effect.
Discusses the Control and the placebo effect.
How science works: The flowchart
|
