Week 5 Plate Tectonics
| 2.7_9_aep_library_research_volcanoes_and_plate_tectonics.docx |
Task 1 Library Research The Dynamic Earth
This research is designed to be completed in 50 minutes in the Library.
Choose one question, make notes and diagrams.
Share your document with the two other group members.
Choose one question, make notes and diagrams.
Share your document with the two other group members.
Task 2 - Class discussion using the research questions above.
Task 3 - Earthquakes and plate boundaries
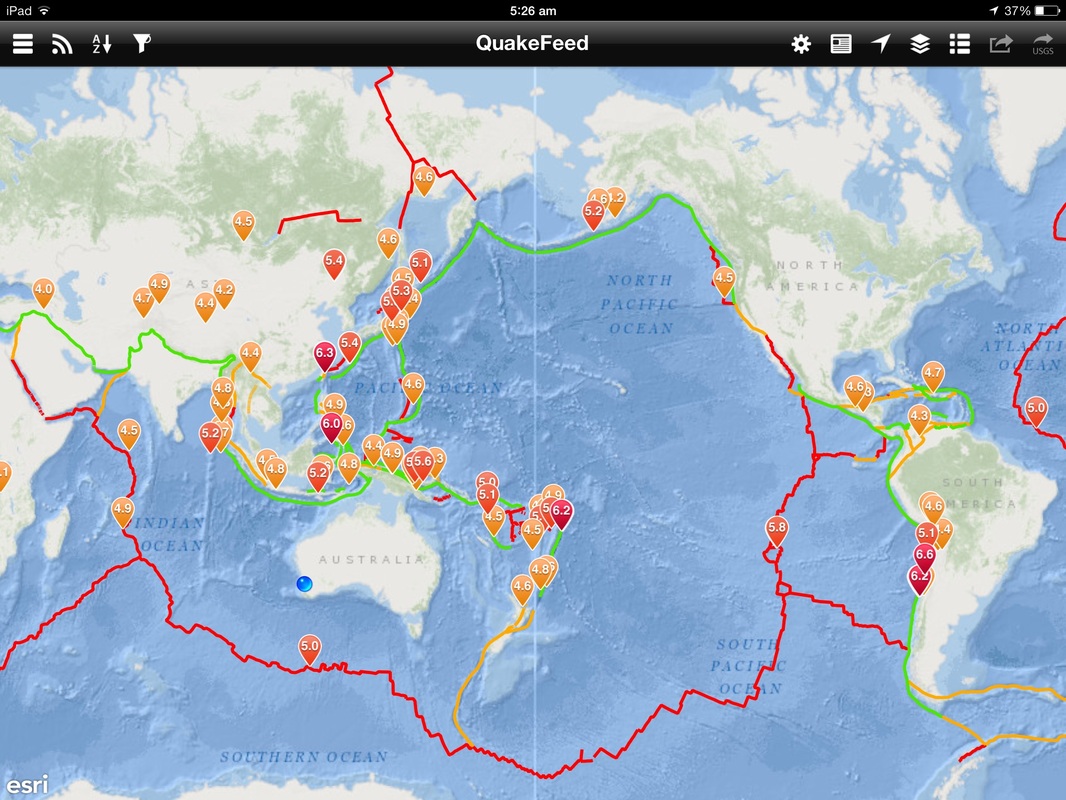
The image below is a screen shot from the App Quakefeed. It gives real time information about earthquakes. The numbers are the value of the earthquake on the Richter Scale.
The green lines represent convergent plate boundaries, the red lines represent divergent plate boundaries, the orange lines represent transform plate boundaries.
|
The image to the right is a graph representing the values of earthquakes on the Richter Scale.
The Richter scale is a logarithmic scale. For example a earthquake of magnitude 7 is ten times as strong as an earthquake of magnitude 6. |
|
|
The image below is of seismograph.
A seismograph is an instrument that records the waves sent out by earthquakes. 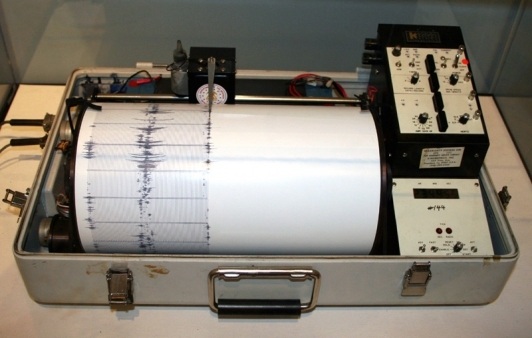
http://www.ogurano.net/uploadedfiles/user/0/Kinemetrics_seismograph.jpg
|
The image below is of a Seismogram.
A seismogram is a printout of the record of the earthquakes waves. 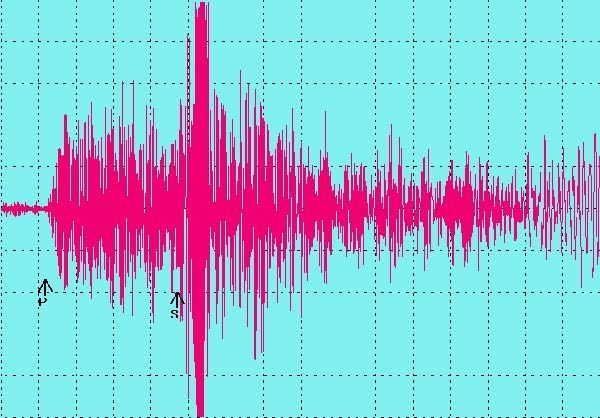
http://en.mercopress.com/data/cache/noticias/12741/0x0/ritcher_scale.jpg
|
Task 4
Watch these short videos to gain an understanding of the mechanism of seafloor- spreading, subduction and earthquakes. Take notes as neccessary.
Past and Future Continents
Pangea and Sea-Floor Spreading
Earth's Interior and plate tectonics
Subduction Animation
Task 5 Consolidation of note making
SA2 earthquakes as agents of catastrophic change
Page 50 questions 3 and 4
SA2 Sea Floor Spreading
Make notes page 49-50 and p 50 question 11, 12, 13, 14
Task 6 Complete Plate Tectonics Sheets
Task 7 Complete Glossary
Make a set of flashcards with the term on one side and the definition and an example of a sentences showing the word in context.
Task 8 Study of the Objectives Weeks 1 to 5
Start at the beginning of the program.
1. Write the heading of the first week's work.
2. Write the first objective.
3. Beneath the objective write relevant notes.
4. Repeat steps 2 and 3 until you reach the next subheading.
5. Repeat steps 2, 3 and 4 until you reach the end of Week 5.

