Week 7
Task 1 Graphing Techniques
On you graph paper complete the template for graphing;
- Variables plotted on correct axes
- Label axes with the identity of the variable
- Write the unit of the variable in brackets
- If both sets of data are continuous plot a line graph. You can think of continuous data as being measured from a scale.
- If one set of data are discrete plot a bar graph. Discrete data may be colours, blood groups, shapes; variables that are not measured using a scale.
- Keep equal intervals within a scale on the axes.
- Make the axes longer than needed so that you can extrapolate
- Plot data points only.
- Join the points with a ruler Do not extend the line to zero.
- Title must be descriptive ie. name both variables and the relationship between them
Task 2 Plot a graph of the class data for boiling points of solutions of different salt concentrations.
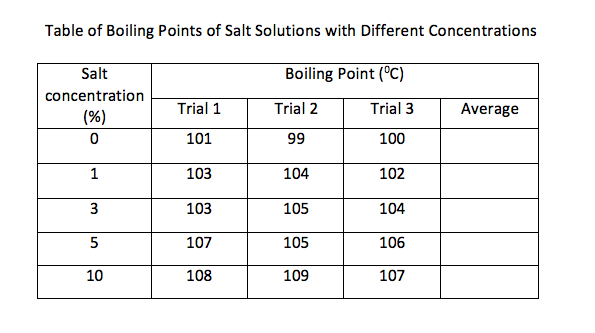
In your white laboratory books complete the requirements for writing your investigation on boiling points of salt solutions.
Task 3 Note-taking and question answering
Science Aspects 1 Focus 1.8
Read pages 35 to 37
Answer questions 1 to 7
Read pages 35 to 37
Answer questions 1 to 7
Task 4 Introduction to the concept of "Matter"
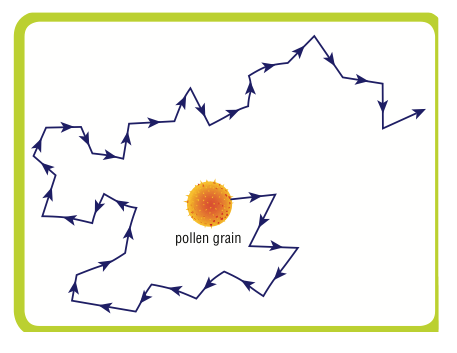
Brownian Motion
|
We cannot see the individual particles which make up water. We can see the effect of these particles on the pollen grain which shows a series of random movements due to being hit by the water particles. |
|
Observing Materials
Spend 5 minutes at each Station..
Record your observations.
Make an inference about the nature of the materials involved.
Complete Science Aspects 1 page 223 Questions 1 to 16
Spend 5 minutes at each Station..
Record your observations.
Make an inference about the nature of the materials involved.
Complete Science Aspects 1 page 223 Questions 1 to 16
